 Make a Suggestion
Ask a Question
Print
Make a Suggestion
Ask a Question
Print Learner Assessment Report
Key to numbers
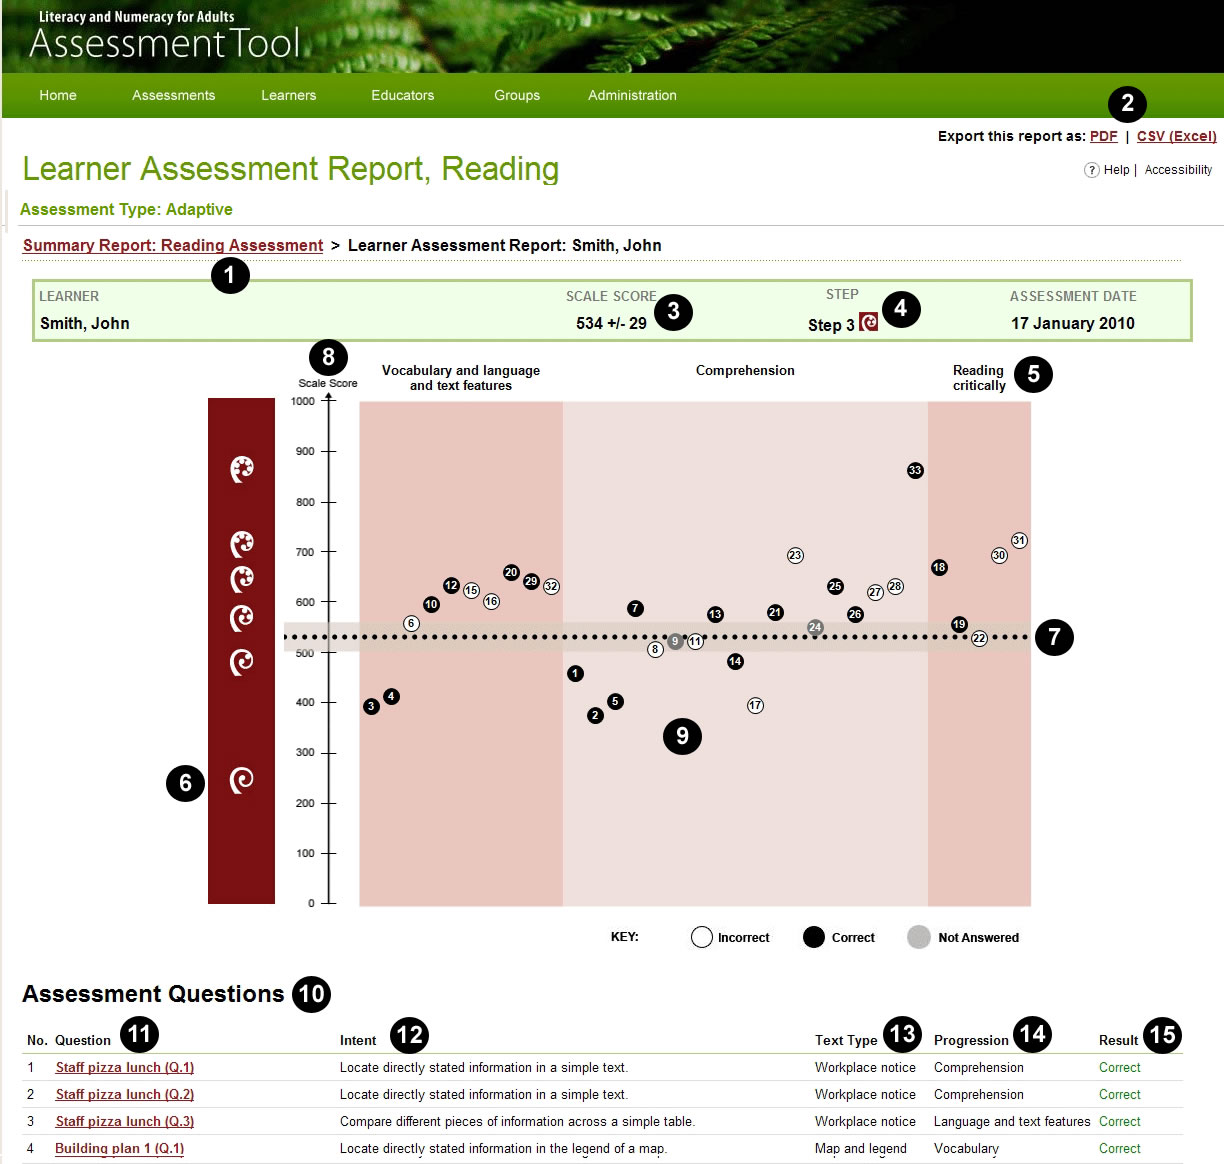
1. The name of the Assessment and type of Assessment.
2. Export this Report. You can download and keep a record of this Report as a PDF or CSV (Excel spreadsheet) by clicking on one of these links.
3. Individual Learner's Scale Score on this Assessment. The Learner in this example (John Smith) has an estimated score of 534 ± 29, meaning that if he sat a similar test, he would probably score between 505 and 563. Note that if the Assessment were a Snapshot Assessment, the Threshhold Decision would also be shown in this area.
4. The Learner's achievement on this Assessment in relation to the progression steps. This Learner achieved Step 3 on this Assessment. Note that in the case of a Snapshot Assessment where a threshold was selected, the Classification of the Learner will also be shown in this area.
5. Progressions or progression clusters assessed. The progressions 'Comprehension', 'Reading critically' and the cluster combining 'Vocabulary' and 'Language and text features' were assessed. Questions relating to each progression or progression cluster are in the shaded column below the progression name.
6. Koru. The koru indicate the steps on the learning progressions. There are six steps, with Step 1 at the bottom of the graph and Step 6 at the top. The spacing of each koru on the scale shows the range of difficulties of questions in the Assessment for that step in the progressions.
7. Individual Learner's estimated result on this Assessment. The dotted line shows this Learner's achievement on this test (534 on the scale, within the Step 3 range). The shaded band around the dotted line shows the range (534 plus or minus 29 Scale Score points = 505 to 563) within which this Learner would probably score if they took any similar test, given their current level of competence.
8. The achievement scale, from 0 to 1000, showing increasing achievement on the learning progressions. The scale also shows the difficulty of the questions.
9. Questions on the Assessment. All the questions included in the Assessment are shown. The position of the circle on the scale shows how difficult the question is for most Learners. Questions higher up the scale are more difficult; questions lower down are easier.
- Black circle this Learner answered the question correctly.
- White circle this Learner answered the question incorrectly.
- Grey circle this Learner did not attempt the question.
10. Assessment questions grid. This is a list of all the questions on this Assessment in the order in which they appeared.
11. Question link. Each item in this column shows the name of the 'unit' (a set of questions about a particular topic) and the number of the question within the unit. Click on the link to view more information about the question.
12. Intent. This column describes the skill or knowledge that each question assesses.
13. Text type. This column shows the kind of reading material that this question asks about. (This column appears on the Reading Report only.)
14. Progression. This column lists the learning progression that is the focus of each question.
15. Result. This column shows whether the Learner answered each question correctly or incorrectly, or did not attempt to answer the question.
More detailed information on the Reports in the Assessment Tool can be downloaded in PDF format here.
Make a Suggestion
Ask a Question
Print | Last reviewed:
20/01/2011 12:29:58 p.m. © Tertiary Education Commission. All rights reserved. |