 Make a Suggestion
Ask a Question
Print
Make a Suggestion
Ask a Question
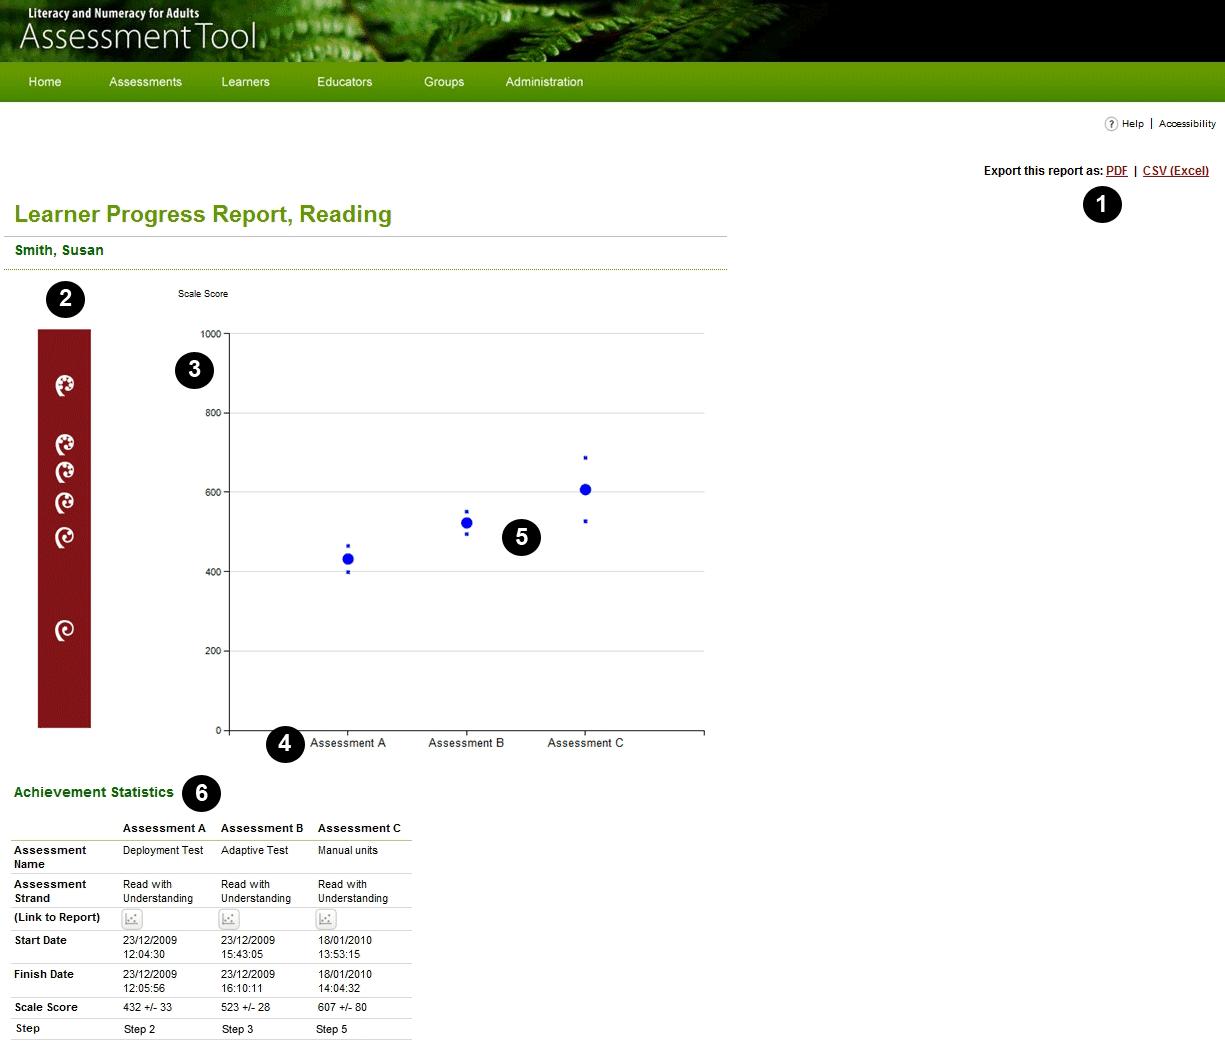
Print Learner Progress Report
Key to numbers
1. Export this Report. You can download and keep a record of this Report as a PDF or CSV (Excel spreadsheet) by clicking on one of these links.
2. Koru. The koru indicate the steps on the learning progressions. There are six steps, with Step 1 at the bottom of the graph and Step 6 at the top. The spacing of each koru on the scale shows the range of achievement of Learners reported as performing at that step.
3. The achievement scale. The vertical axis shows a scale from 0 to 1000, indicating increasing achievement on the learning progressions. All the Assessments are linked within each strand (Numeracy, Reading or Writing), so that the scale scores have the same meaning regardless of which Assessment within the strand is included in the Report. However, results on different strands (for example, Numeracy and Reading) should not be compared.
4. The Assessments. The horizontal axis shows a label for each Assessment included in the Report. Up to five Assessments may be shown on one Learner Progress Report. This example shows three Assessments: Assessment A, B and C.
5. Plotted results. Each plot shows the Learner's result on one Assessment.
- The large dot in the middle of the plot represents the best estimate of the Learner's result on this occasion.
- The smaller dots above and below each large dot show the 'confidence interval' of the result. This means that the Learner would probably have scored somewhere between the two smaller dots if she had taken a similar test around the same time, given her level of competence at that time.
6. Achievement Statistics. This table provides more detail about the Assessments included in the Report.
- The labels at the top identify the Assessments as shown on the graph (in this example, Assessment A, B and C).
- The next three rows show the actual names of each Assessment, the type of Assessment and the strand assessed.
- In the (Link to Report) row you can click on an icon to review the Learner Assessment Report for an Assessment.
- The Start Date and Finish Date rows present the dates and times that the Learner did each Assessment. This information allows you to see the period of time over which the Learner's results are tracked.
- The Scale Score row shows the Learner's estimated score on each Assessment, including the confidence interval. For example, in Assessment A (Deployment Test) the Learner had an estimated score of 432 ± 33. This means that if she had completed a similar test at around the same time, she would probably have scored between 399 and 465. These scores match the plot for Assessment A on the graph.
- The Step row shows the Step on the Learning Progressions for the Scale Score achieved.
More detailed information on the Reports in the Assessment Tool can be downloaded in PDF format here.
Make a Suggestion
Ask a Question
Print | Last reviewed:
8/07/2011 4:46:27 p.m. © Tertiary Education Commission. All rights reserved. |